
جوري
Soldier Through It!
- Messages
- 27,759
- Reaction score
- 6,095
- Gender
- Female
- Religion
- Islam
Statistics:
1- Giving everyone a test, wanting to find out how everyone did one ends up with loose individual scores.. they need to be put in a 'container' this container is called a distribution .. with that we don't have to remember individual numbers but a few summary numbers, and by those few summary numbers. we need to.. measure of central tendency (that lies in the middle of a bell shaped curve) and the other is the spread, how 'narrow' or 'broad' the distribution being used:
now not all curves are normal.. some are skewed, some are skewed to the left some are skewed to the right.
positive skew the tail will point o the right, negative skew the tail will be to the left
on positive curve there will be three points 1, 2, 3
one is the mean, one is the median and one is the mode, which is which?
the mean will be 3 which is the last line to the tail of the positive curve, median of course is 2, and mode is 1.. go out to the tail and count in mean, median, mode in alphabetical order so now you can never forget this
to find out if a distribution is skewed or not compare the mean (the average) to the median (middle number) if mean is greater than the median then we have a POSITIVE skew .. if mean is less than the median then we have a NEGATIVE distribution.
for normal distribution the measure of central tendency we have is the mean (the average) -- on a skewed distribution however, the mean (average) isn't the best measure of central tendency instead you use the median!
in addition to central tendency, another parameter of importance to get a sense of the distribution, which is the measure of variation or spread .. we need to know how narrow or wide is the distribution on a a bell shaped curve .
one of the most common is called the range the range is basically the difference between the highest and the lowest score on a bell shaped curve .. but it is a poor measure of the spread.. the range ignores all the data and worries only about two extreme scores. if given a test the extreme scores are likely to shift on another re-examination in a very likely direction and that direction is down closer toward the mean (average) the phrase to describe this phenomenon is called 'regression towards the mean' -- extreme values when re-measured will be less extreme!
let's say you are seeing a patient and s/he has very high blood pressure, you take measures to lower that pressure and ensure that they come back in a week for a re-measurement.. upon remeasurement their pressure is lower.. this isn't because of the diet/exercise/ medication, it is rather a 'regression toward the mean'
the range is thus a poor measure of score because it is concerned with the least stable scores we have ..
so if we don't use the range what should we use?
let's take every score and label it x and subtract from it
_
x called x bar which is how we represent the mean we put those results in quantities i.e parenthesis ( ) and let's sum them together
 that is to see how close or far away from the mean every single score is, if it is close to the mean (average) we get a small value, if it is away from the mean we get a large value.. so we are getting the average deviation, but this formula doesn't work because the number it will always give us for any data is zero!
since for every number above the mean one below the mean, so statisticians squared these values, this way positives and negatives don't cancel each other out, but every number gets larger and larger .. now if we have a sample in the twenties and a sample in the two thousands the one in the two thousands would end up with a much larger number and that is because we are taking 2000 differences instead or 20 so to fix this problem we divide by the sample size which we label N (-1) the minus one is a degree of freedom, now since we 'squared' the numbers not to end up with zero we have to account for that by taking the square root of the entire formula and this is the formula for 'standard deviation' utterly broken down to its basic components!
so s=
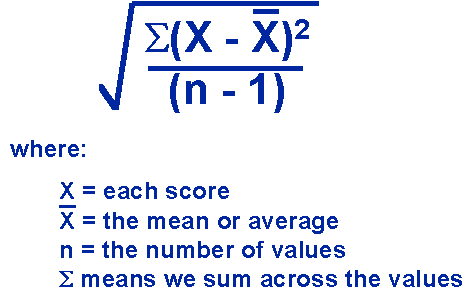
now hopefully everyone understands what the standard deviation is and how the statisticians derived its variables. in a nutshell how close or how far every score is from the mean and taking its average.. that is what the standard deviation is!
so now if you are asked a simple question like
1- as the sample size increases the standard deviation increases? true or false? well if you've been paying very close attention to the above the answer will be false!
this is an average deviation, every time we added something up, we added something to n on the bottom so that the standard deviation doesn't change with sample size.
application here far outweighs being able to do the calculation.
here is a normal distribution curve:

now let's talk about percentages within 1~2~3 standard deviation of the mean (average) please have it memorized .. these figures are a constant!
numbers on top .. what numbers fall within one standard deviation from the mean is roughly ~68%
+/- two standard deviations is 95.5%
=/- 3 standard deviation is 99.7%
now let's look at just one particular area of the curve.
what percentage falls within the mean and one standard deviation (above) the mean
34% since that is half of the 68%
1~2 above is 13.5%
2~3 above 2.4%
what is left of the tail about 1.5%
the numbers ought to add to 100% but they don't since we have rounded numbers (easier to work with)
question 1- what percent of the cases that are normal distribution fall above one standard deviation below the mean (average) that is 34 + 50 (why plus 50) because the mean is also the median so it will be the 34 + 50= 84%
2- what percent of cases fall below two standard deviation below the mean roughly 2.5%
mean and standard deviation of the IQ distribution:
the mean of the IQ= 100
standard deviation is 15
what percentage of the population has an IQ below 70%
100-15= 85
what percentage is less than that.. (if you are having a difficult time please refer to the bell shaped curve) the percentage less than 70 on the curve will be 2.5%
if 100 i exactly in the measure of central tendency i.e lying right in the middle, and below the mean is going to the left of the curve.. (hope that makes it easier)
2- what percent of the population has an IQ over 130?
since it is a 'symmetric distribution) it is 2.5% on the other side as well!
USMLE has a mean of 200 and a standard deviation equal to 20 .
if you score 240 on the exam what percentile are you?
50+ 34+ 13.5= with a score averaging in the 97.5%
that percentile is how many people you beat, so you start at the bottom below the measure of central tendency that is 50% + add the other figures in and derive your score in percentage!
a schoolboy took two tests
test A and B for test A he got 60% on test B he got 50%
on which test did he do better? (no idea) since scores are only meaningful when related to distribution out of which they came
we measure distribution by central tendency .. the mean for test A was 40% mean for test B is 45%
still don't know on which test he has done better, since we also need standard deviation along with central tendency
standard deviation for test A = 20
standard deviation for test B = 5
so he did absolutely the same on both exams.
go to 40 and start adding standard deviations .. both tests he scored in the 84% percentile.
__________________________________________________________
now to use this for medical research
we have a new test, given to a random cross section of the population
95% got a score between 150-250
what is the 84% percentile on this test?
150 to 250 95% of the cases .. this is roughly +/- 2 standard deviations .. if this is a symmetric distribution our best guess about the mean is about 200
to get to the 84% you need mean + one standard deviation
 + 15
+ 15
the mean is 200 and two standard deviation = 50 then one standard deviation = 25
therefore 200+25= 225
recap. 95% cases between 150-250
think normal distribution +/- two standard deviations
since it is a symmetric distribution the mean is right in the center thus 200 is a likely estimate of what the mean is .. now to get to the 84% percentile we need one standard deviation from the mean . if +/- 50 = two standard deviation then half of that is one standard deviation .. add the two and derive the answer.
based on this data the 16th percentile would be the mean minus one standard deviation and that is 200-25= 175
1- Giving everyone a test, wanting to find out how everyone did one ends up with loose individual scores.. they need to be put in a 'container' this container is called a distribution .. with that we don't have to remember individual numbers but a few summary numbers, and by those few summary numbers. we need to.. measure of central tendency (that lies in the middle of a bell shaped curve) and the other is the spread, how 'narrow' or 'broad' the distribution being used:
- central tendency .. the way to measure CT is by the mean, median and mode
- the mean being the average
- median being the middle number
- mode is the most common
now not all curves are normal.. some are skewed, some are skewed to the left some are skewed to the right.
positive skew the tail will point o the right, negative skew the tail will be to the left
on positive curve there will be three points 1, 2, 3
one is the mean, one is the median and one is the mode, which is which?
the mean will be 3 which is the last line to the tail of the positive curve, median of course is 2, and mode is 1.. go out to the tail and count in mean, median, mode in alphabetical order so now you can never forget this
- the mean is most sensitive to extreme values because it is an average of them
to find out if a distribution is skewed or not compare the mean (the average) to the median (middle number) if mean is greater than the median then we have a POSITIVE skew .. if mean is less than the median then we have a NEGATIVE distribution.
for normal distribution the measure of central tendency we have is the mean (the average) -- on a skewed distribution however, the mean (average) isn't the best measure of central tendency instead you use the median!
in addition to central tendency, another parameter of importance to get a sense of the distribution, which is the measure of variation or spread .. we need to know how narrow or wide is the distribution on a a bell shaped curve .
one of the most common is called the range the range is basically the difference between the highest and the lowest score on a bell shaped curve .. but it is a poor measure of the spread.. the range ignores all the data and worries only about two extreme scores. if given a test the extreme scores are likely to shift on another re-examination in a very likely direction and that direction is down closer toward the mean (average) the phrase to describe this phenomenon is called 'regression towards the mean' -- extreme values when re-measured will be less extreme!
let's say you are seeing a patient and s/he has very high blood pressure, you take measures to lower that pressure and ensure that they come back in a week for a re-measurement.. upon remeasurement their pressure is lower.. this isn't because of the diet/exercise/ medication, it is rather a 'regression toward the mean'
the range is thus a poor measure of score because it is concerned with the least stable scores we have ..
so if we don't use the range what should we use?
let's take every score and label it x and subtract from it
_
x called x bar which is how we represent the mean we put those results in quantities i.e parenthesis ( ) and let's sum them together
since for every number above the mean one below the mean, so statisticians squared these values, this way positives and negatives don't cancel each other out, but every number gets larger and larger .. now if we have a sample in the twenties and a sample in the two thousands the one in the two thousands would end up with a much larger number and that is because we are taking 2000 differences instead or 20 so to fix this problem we divide by the sample size which we label N (-1) the minus one is a degree of freedom, now since we 'squared' the numbers not to end up with zero we have to account for that by taking the square root of the entire formula and this is the formula for 'standard deviation' utterly broken down to its basic components!
so s=
now hopefully everyone understands what the standard deviation is and how the statisticians derived its variables. in a nutshell how close or how far every score is from the mean and taking its average.. that is what the standard deviation is!
so now if you are asked a simple question like
1- as the sample size increases the standard deviation increases? true or false? well if you've been paying very close attention to the above the answer will be false!
this is an average deviation, every time we added something up, we added something to n on the bottom so that the standard deviation doesn't change with sample size.
application here far outweighs being able to do the calculation.
here is a normal distribution curve:
now let's talk about percentages within 1~2~3 standard deviation of the mean (average) please have it memorized .. these figures are a constant!
numbers on top .. what numbers fall within one standard deviation from the mean is roughly ~68%
+/- two standard deviations is 95.5%
=/- 3 standard deviation is 99.7%
now let's look at just one particular area of the curve.
what percentage falls within the mean and one standard deviation (above) the mean
34% since that is half of the 68%
1~2 above is 13.5%
2~3 above 2.4%
what is left of the tail about 1.5%
the numbers ought to add to 100% but they don't since we have rounded numbers (easier to work with)
question 1- what percent of the cases that are normal distribution fall above one standard deviation below the mean (average) that is 34 + 50 (why plus 50) because the mean is also the median so it will be the 34 + 50= 84%
2- what percent of cases fall below two standard deviation below the mean roughly 2.5%
mean and standard deviation of the IQ distribution:
the mean of the IQ= 100
standard deviation is 15
what percentage of the population has an IQ below 70%
100-15= 85
what percentage is less than that.. (if you are having a difficult time please refer to the bell shaped curve) the percentage less than 70 on the curve will be 2.5%
if 100 i exactly in the measure of central tendency i.e lying right in the middle, and below the mean is going to the left of the curve.. (hope that makes it easier)
2- what percent of the population has an IQ over 130?
since it is a 'symmetric distribution) it is 2.5% on the other side as well!
USMLE has a mean of 200 and a standard deviation equal to 20 .
if you score 240 on the exam what percentile are you?
50+ 34+ 13.5= with a score averaging in the 97.5%
that percentile is how many people you beat, so you start at the bottom below the measure of central tendency that is 50% + add the other figures in and derive your score in percentage!
a schoolboy took two tests
test A and B for test A he got 60% on test B he got 50%
on which test did he do better? (no idea) since scores are only meaningful when related to distribution out of which they came
we measure distribution by central tendency .. the mean for test A was 40% mean for test B is 45%
still don't know on which test he has done better, since we also need standard deviation along with central tendency
standard deviation for test A = 20
standard deviation for test B = 5
so he did absolutely the same on both exams.
go to 40 and start adding standard deviations .. both tests he scored in the 84% percentile.
__________________________________________________________
now to use this for medical research
we have a new test, given to a random cross section of the population
95% got a score between 150-250
what is the 84% percentile on this test?
150 to 250 95% of the cases .. this is roughly +/- 2 standard deviations .. if this is a symmetric distribution our best guess about the mean is about 200
to get to the 84% you need mean + one standard deviation
the mean is 200 and two standard deviation = 50 then one standard deviation = 25
therefore 200+25= 225
recap. 95% cases between 150-250
think normal distribution +/- two standard deviations
since it is a symmetric distribution the mean is right in the center thus 200 is a likely estimate of what the mean is .. now to get to the 84% percentile we need one standard deviation from the mean . if +/- 50 = two standard deviation then half of that is one standard deviation .. add the two and derive the answer.
based on this data the 16th percentile would be the mean minus one standard deviation and that is 200-25= 175
")

") . I'll also me starting immunology - is it a tough subject?
. I'll also me starting immunology - is it a tough subject?


